All Samples
Draw using FleeBooleanStyle
The sample shows how to style a map using the FleeBooleanStyle. In this example, the hightlighted features are the landlocked countries whose population is greater than 10 million.
Using Predefined Styles
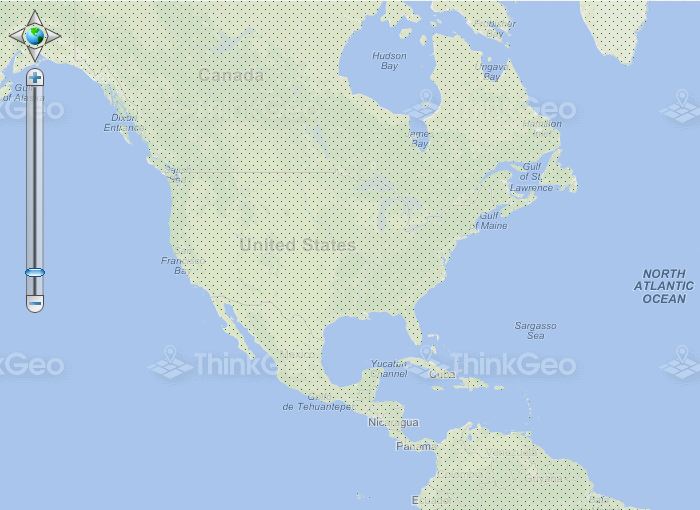
Map Suite MVC Edition includes numerous built-in styles like these, which allow you easily set up a visually appealing map.
Draw a Point Using a Bitmap
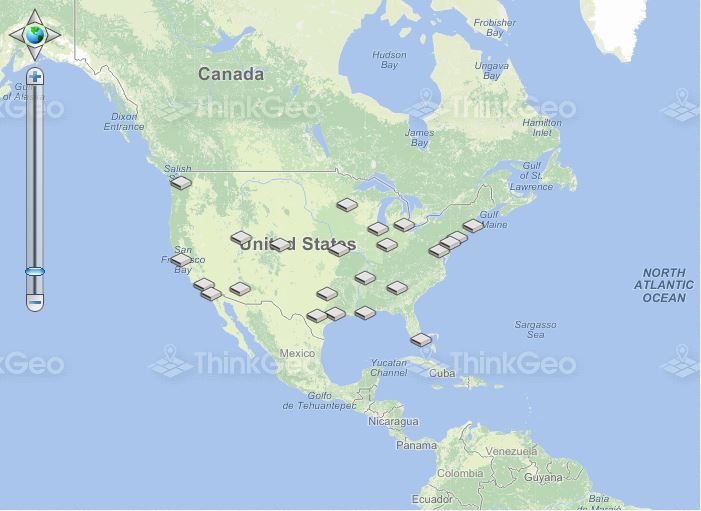
This sample shows how to mark a point on the map using a custom bitmap image.
Draw Features Based on a Value
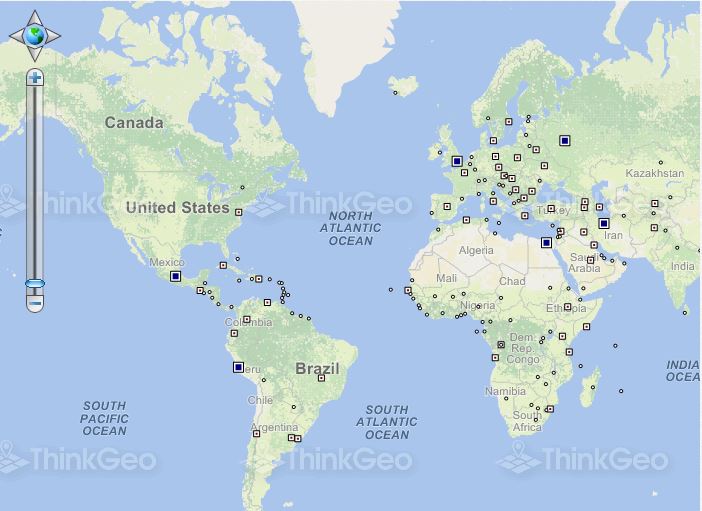
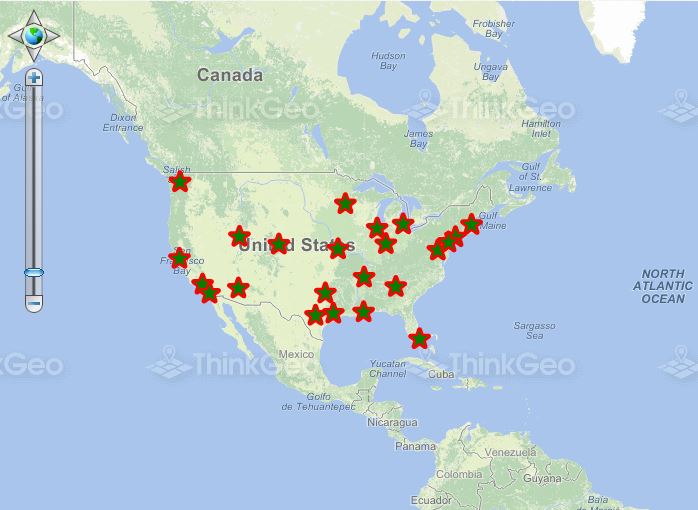
This sample renders cities in different styles based on their "POP_RANK" data value.
Change the Fill and Outline Colors
This sample shows how to change the fill and outline colors of a polygon at runtime.
Change the Width and Color of a Line
This sample shows how to change the width and color of a line at runtime.
Convert GeoColor to/from OLE, Win32, HTML, or ARGB Colors
This sample shows how to convert GeoColor to and from OLE, Win32, HTML, or ARGB colors.
Get a Group of Colors in the Same Quality (Hue) Family
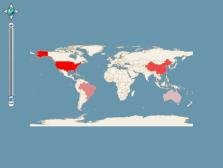
In this sample, we use a group of colors in the same family of red (but with different strengths) to draw five different countries.
Draw using ZedGraphStyle
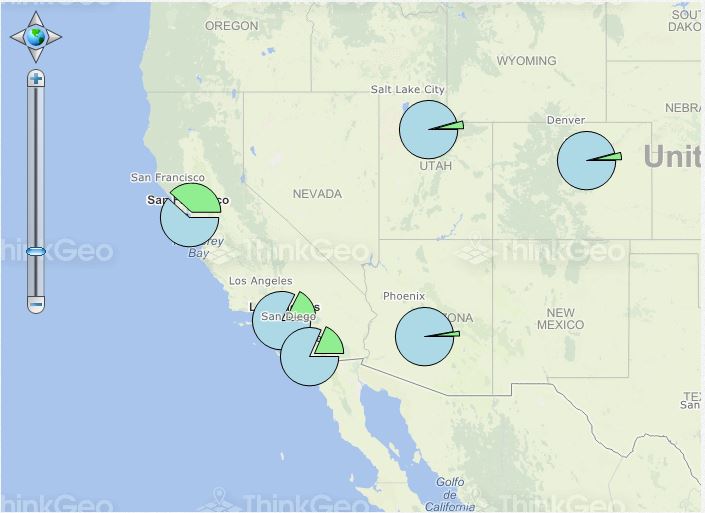
This sample shows how to add pie graphs to the map using the ZedGraph library.