Styles
Dot Density Drawing Using Numerical Data
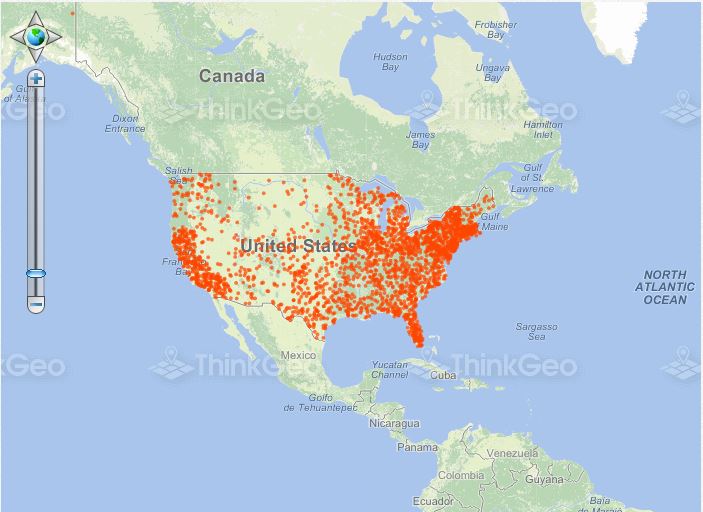
This sample uses a different density of dots to represent different populations of U.S. states.
Draw Features Based on a Regular Expression
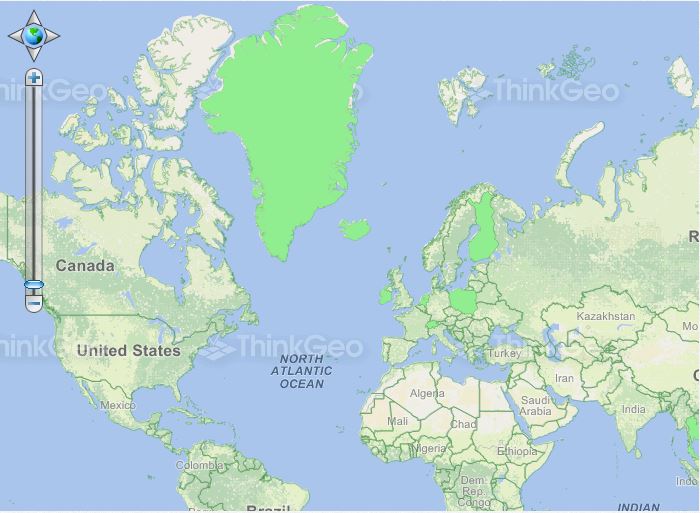
In this sample, we use a regular expression to draw countries that have the string "land" in their name (such as Greenland) using a distinct style.
Draw Thematic Features
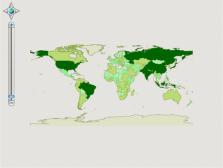
In this sample, we have broken down the population of each country into ranges and then used different colors to represent the ranges.
Using Geographic, Simple and Standard Colors
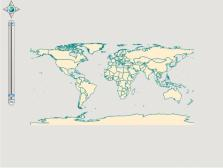
This sample shows how to change the border and fill colors by using built-in styles.